
Role: Design Team Lead
As Design Team Lead at news.com.au, a key aspect of my role was developing innovative visual approaches for storytelling, including breaking news coverage. Transforming complex data and news into visually compelling, informative, and engaging stories was a challenging task. Our design team tackled this by crafting creative designs, collaborating closely with journalists, stakeholders, verifying data accuracy, and managing expectations—all within tight deadlines. Many of these projects were conceptualized, designed, and launched on the same day.
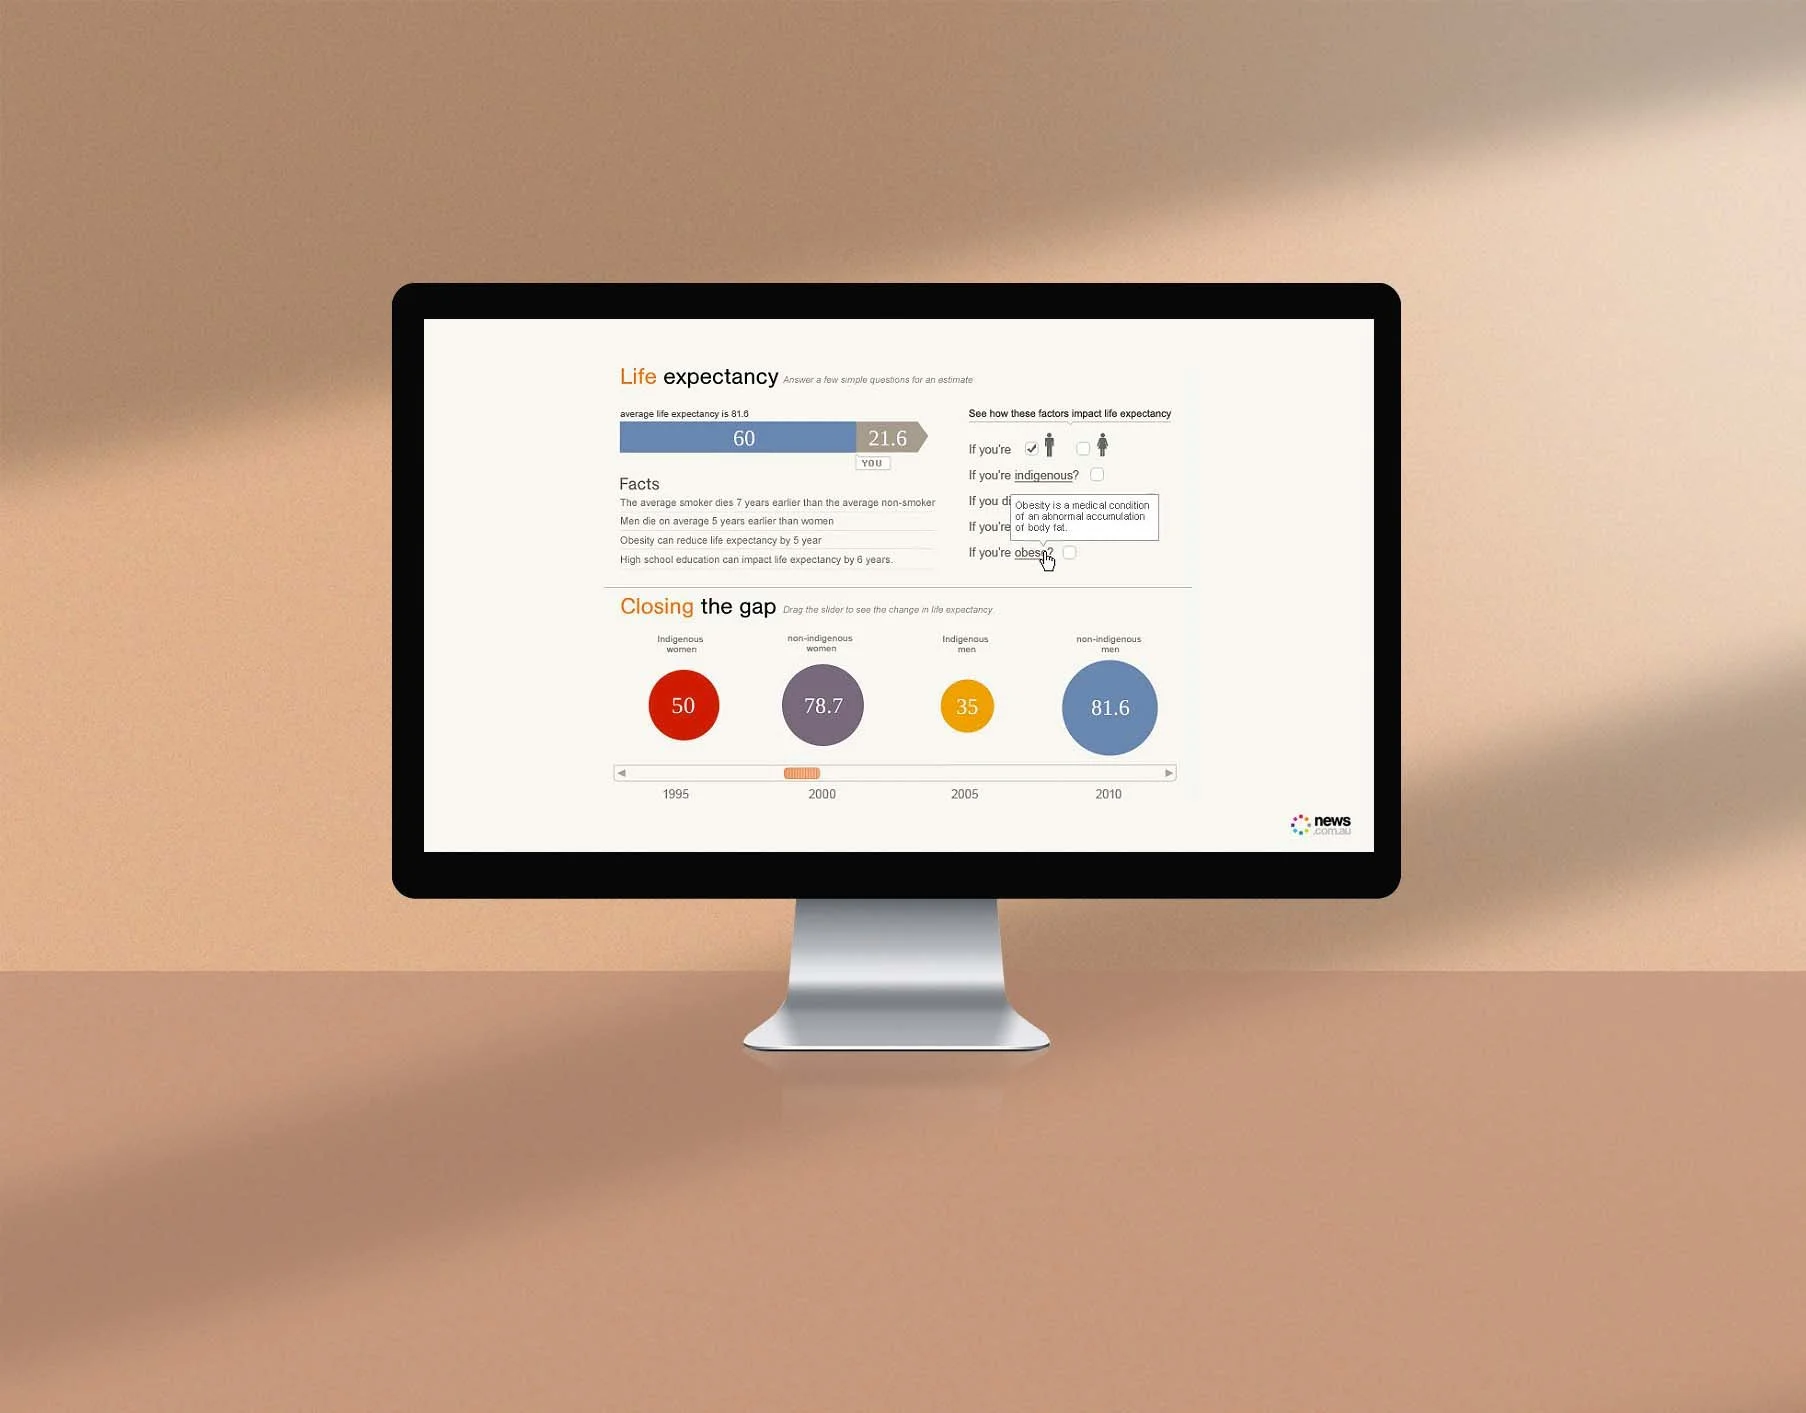
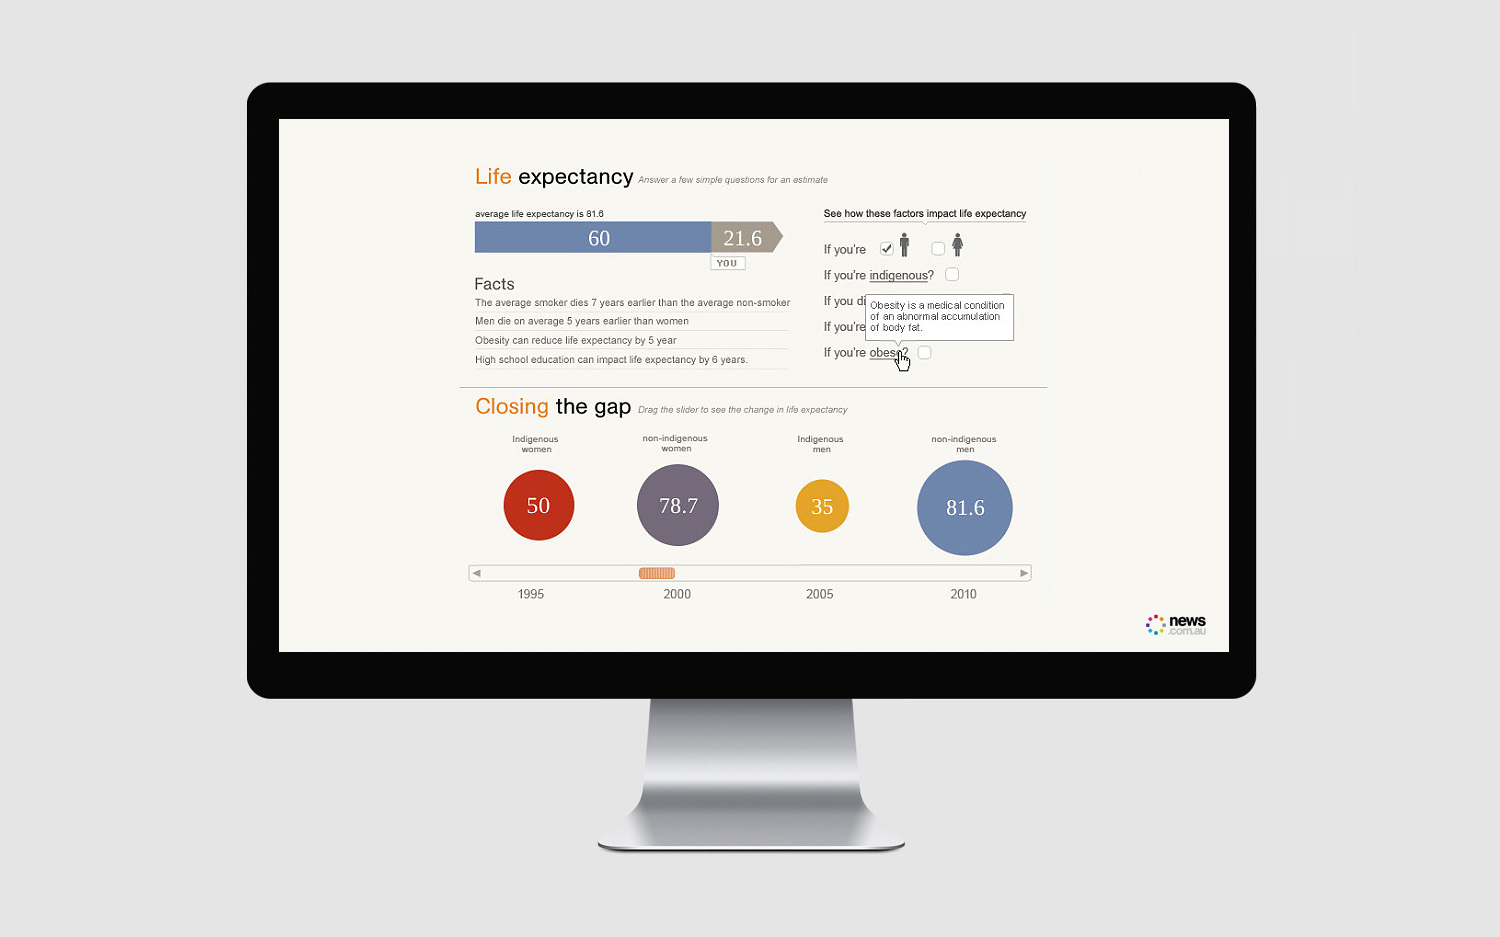
BEING born black in Australia is as much of a health risk as being a regular smoker or drastically overweight.That is the clear message from the data included in governement figures used to compile the annual Closing the Gap report, released last month but overshadowed by the wave of natural disasters hitting Queensland and other states. The interactive allows you to take a closer look at the inequality and put yourself at the centre of the issue. It allows you to see how your lifestyle choices take years off your own life. And here is a sobering thought - Indigenous Australians face a similar shortened life span even from birth.This data viz was part of an in-depth story reported by news.com.au in 2010.
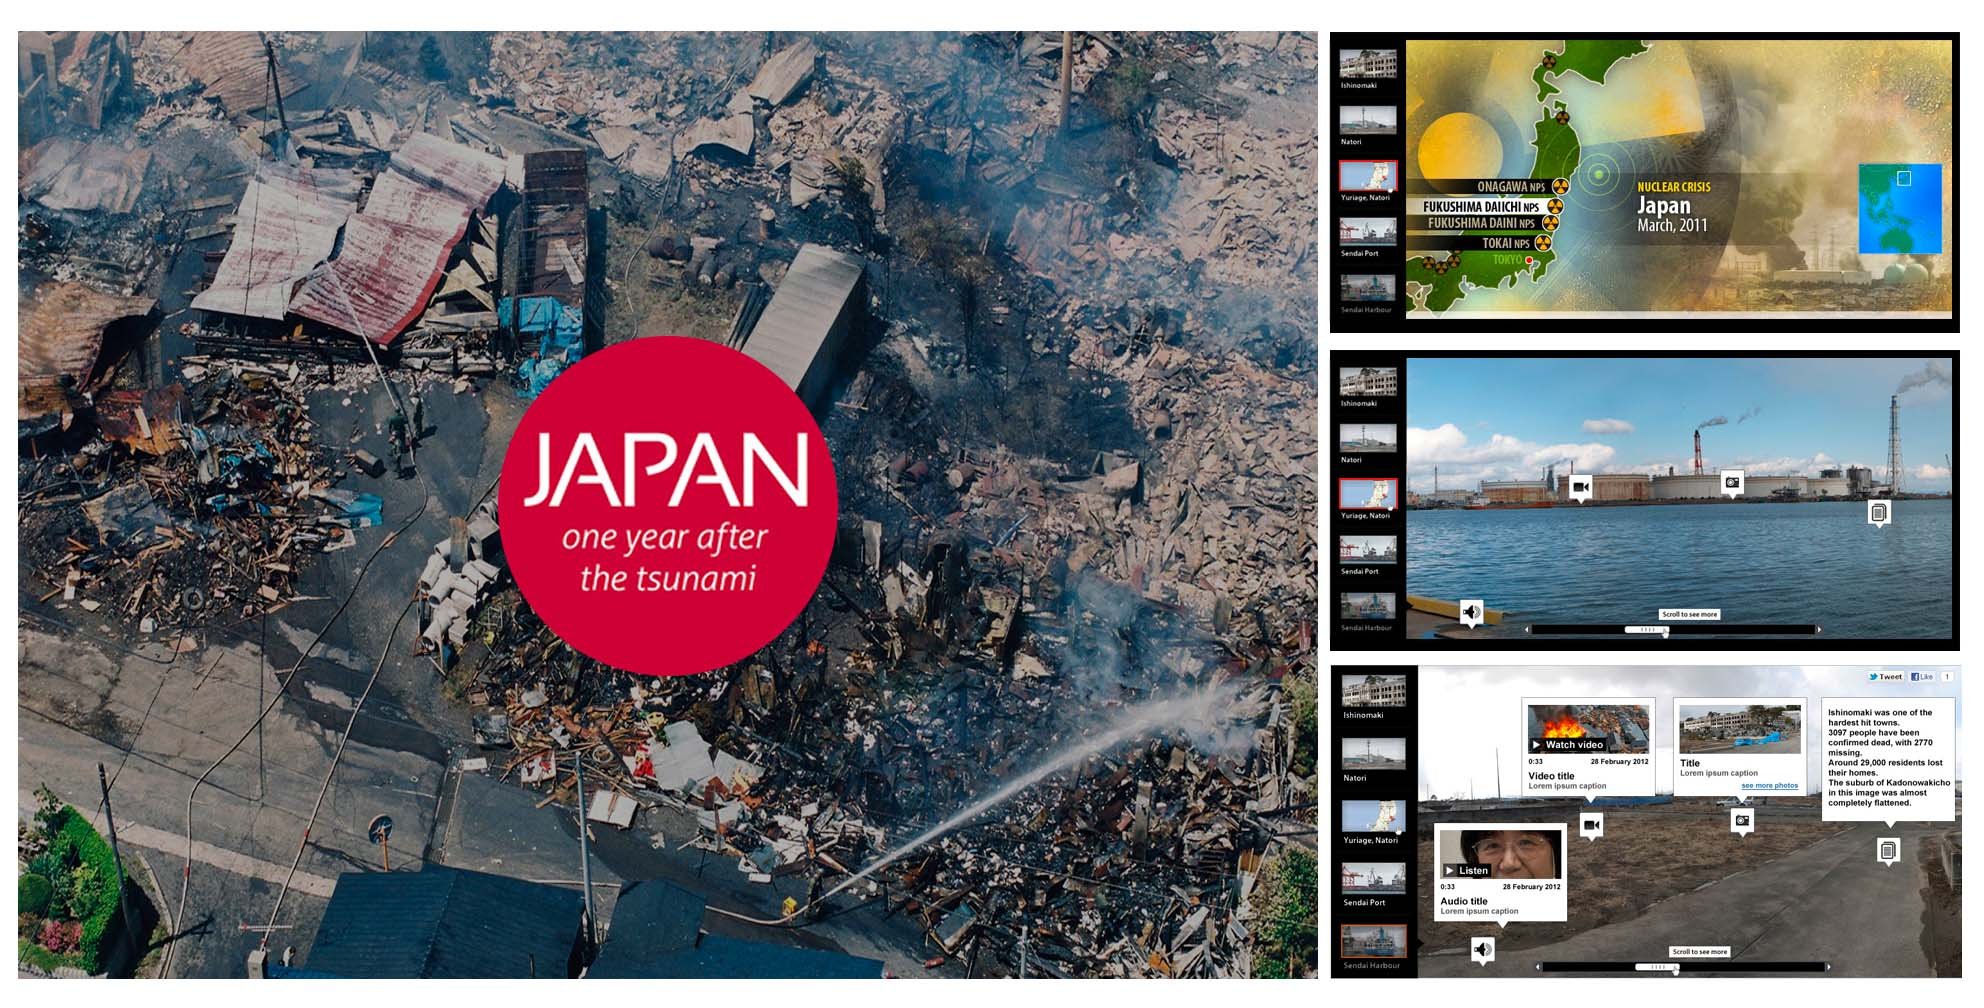
IT was a year since one of the most catastrophic tsunamis in history struck Japan's east coast.The earthquake measured 9.0 on the Richter scale - the giant wave caused unimaginable devastation, claiming more than 15,000 lives. One year later, as the colossal rebuilding task continues, the country remains battered. Daily life has changed in unexpected ways.
To mark the one year after the tsunami, we designed a panoramic tool of key areas in Japan containing videos, photographs and further information about the devastated regions. The objective of the interactive was to tell a story on the rebuilding and recovery of the different places affected by the tsunami rather than displaying infographical data or re-using our Before/After slider.
It is a sensitive and sombre event, we designed an interactive piece that respectfully tells their stories. The design is very sleek and very visual.
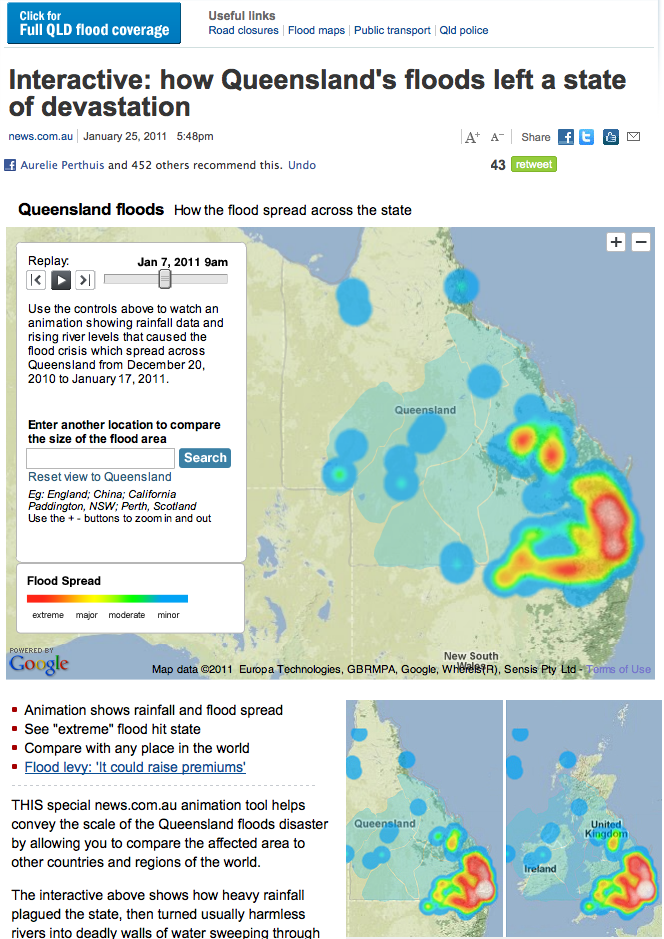
In late November 2010, rain began falling in Queensland. By January 2011, extensive flooding had impacted 75 per cent of the state and a disaster zone was declared. In total, 33 people lost their lives, with three bodies never recovered and declared deceased by the State Coroner in June 2012. Evacuations numbers totaled 5 900 people from 3 600 homes. An estimated 28 000 homes were in need of rebuilding; scores more would require extensive repairs. The final report of a judicial inquiry into the event was published in March 2012.
We did a series of interactives during this massive breaking news story to show live data and how each city was impacted.
It is important to note that all these interactives were designed and developped on the day.
(motion graphics)
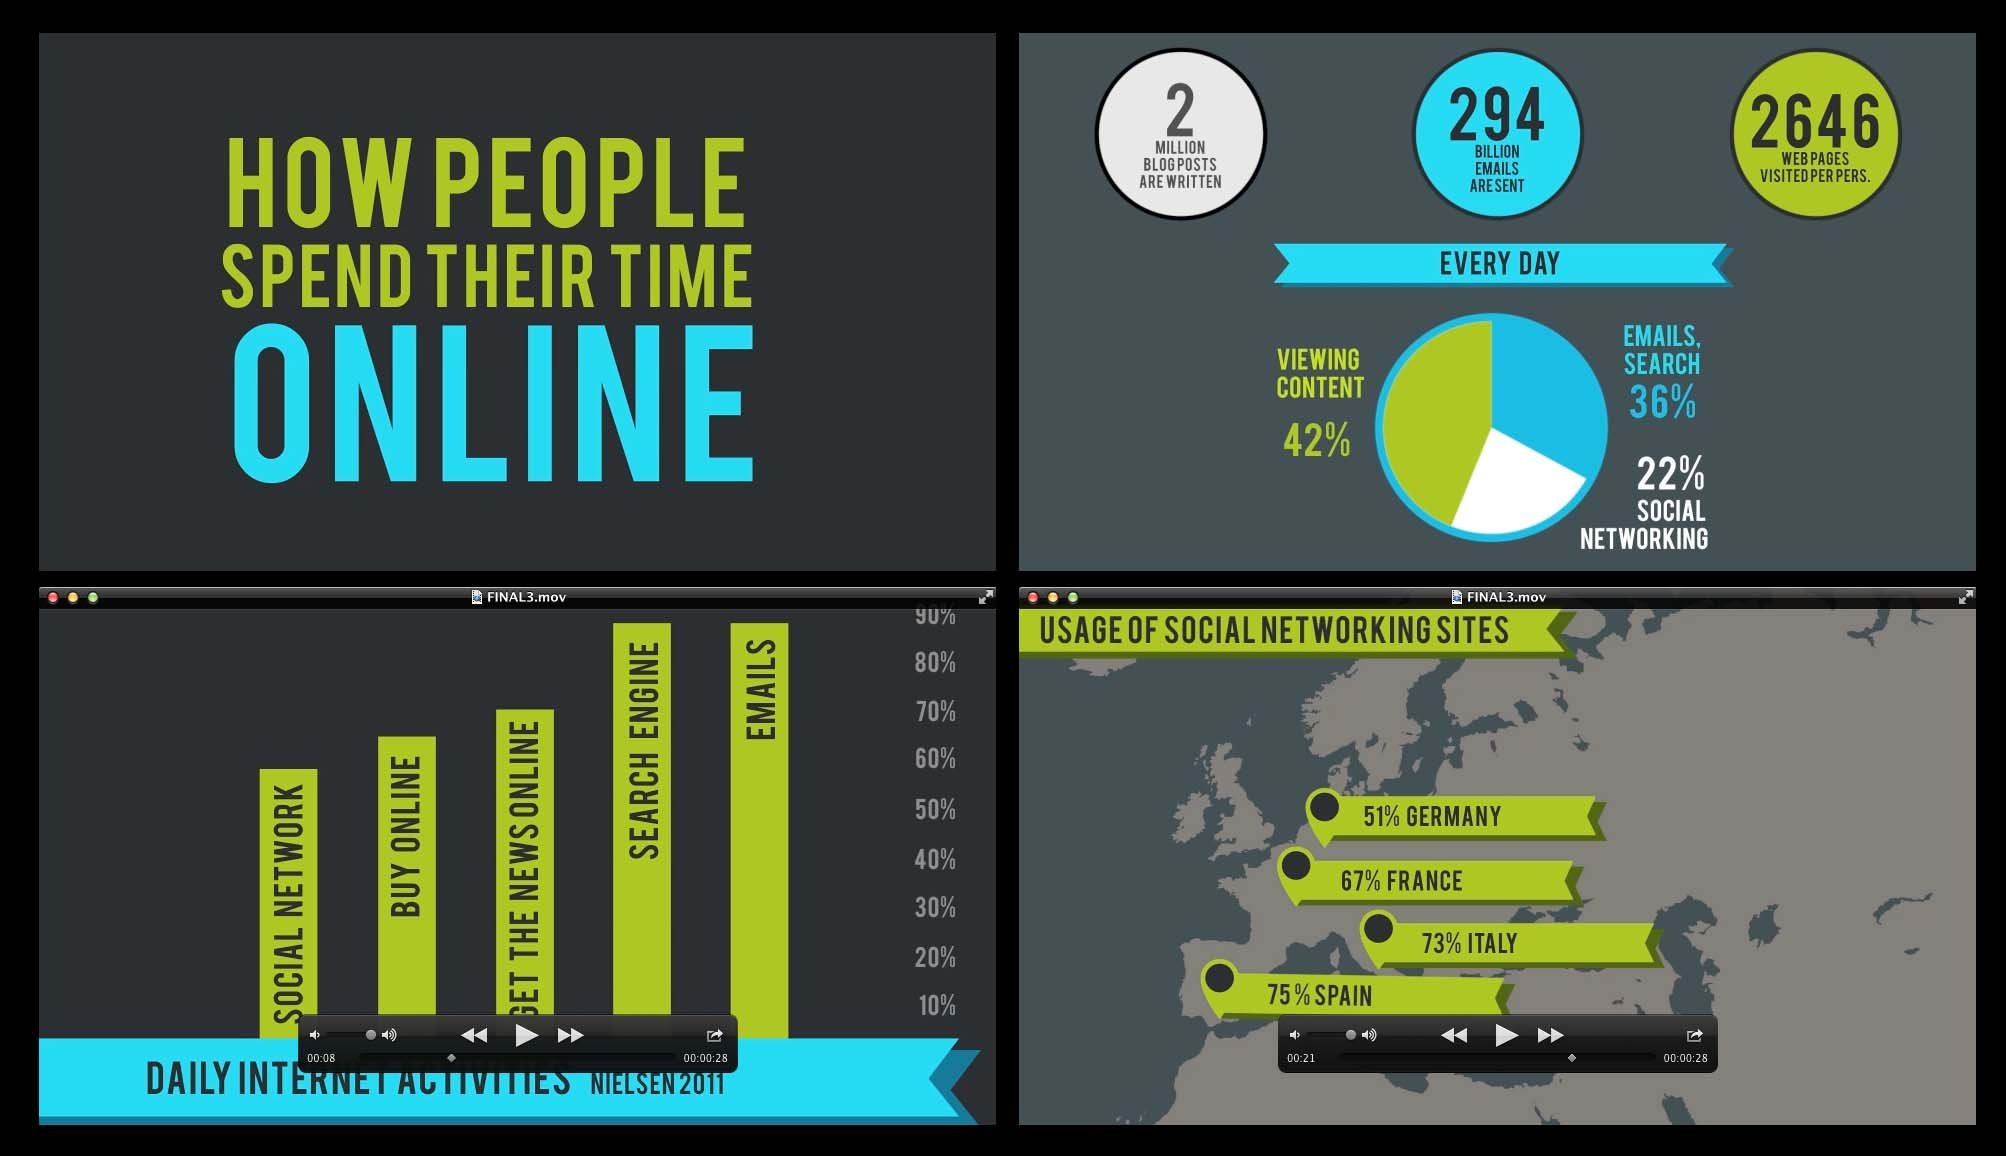
Have you ever wondered what a normal Internet user do? How do people spend their time online. What are the most popular Internet activities. What are the most visited websites? Or on What websites People Spend most of their time.
This motion graphics video shows How people spend their time online.
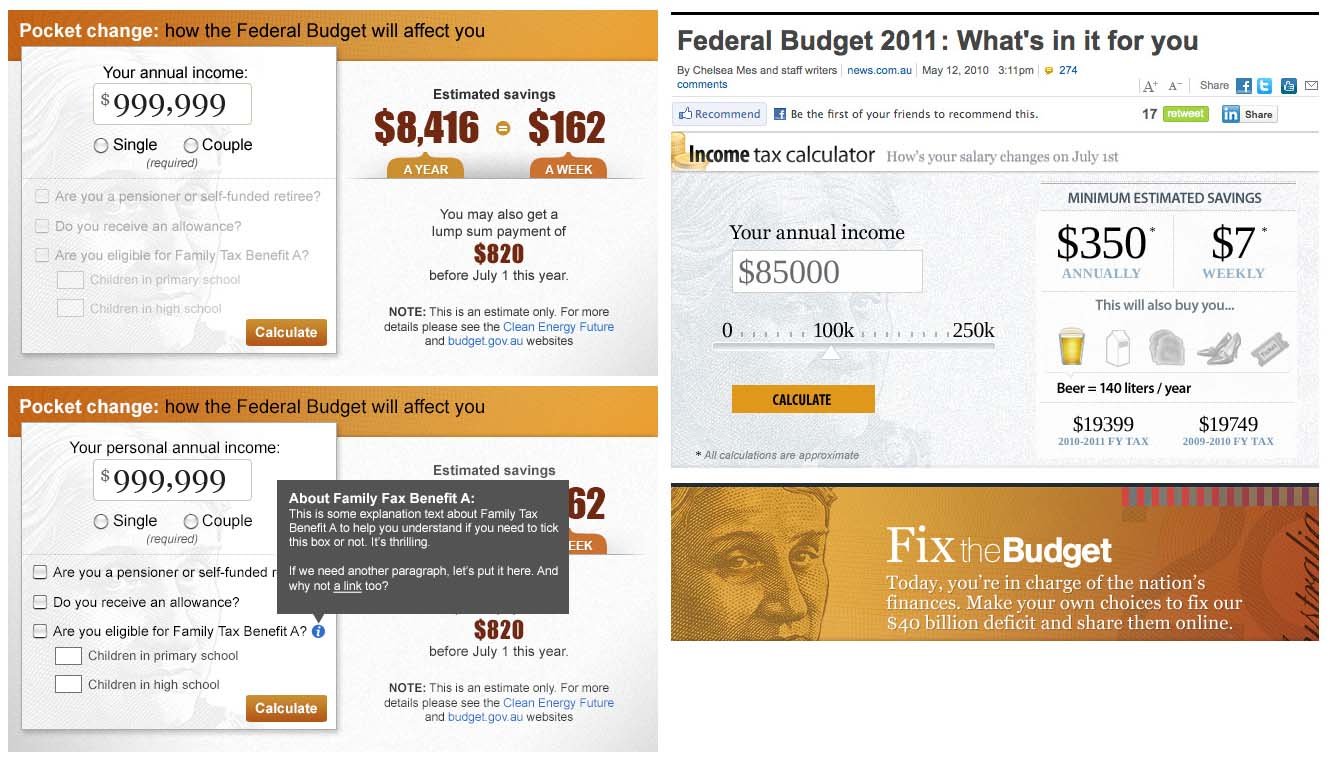
The news.com.au design team put together a Budget calculator to find out what the news.com.au readers will get.
Creative Director: Simon Wright
Design team lead : Aurélie Perthuis Furzer (Lily)
Designer : Vincent Vergara
Editorial team: Lincoln Archer / Helen Davidson
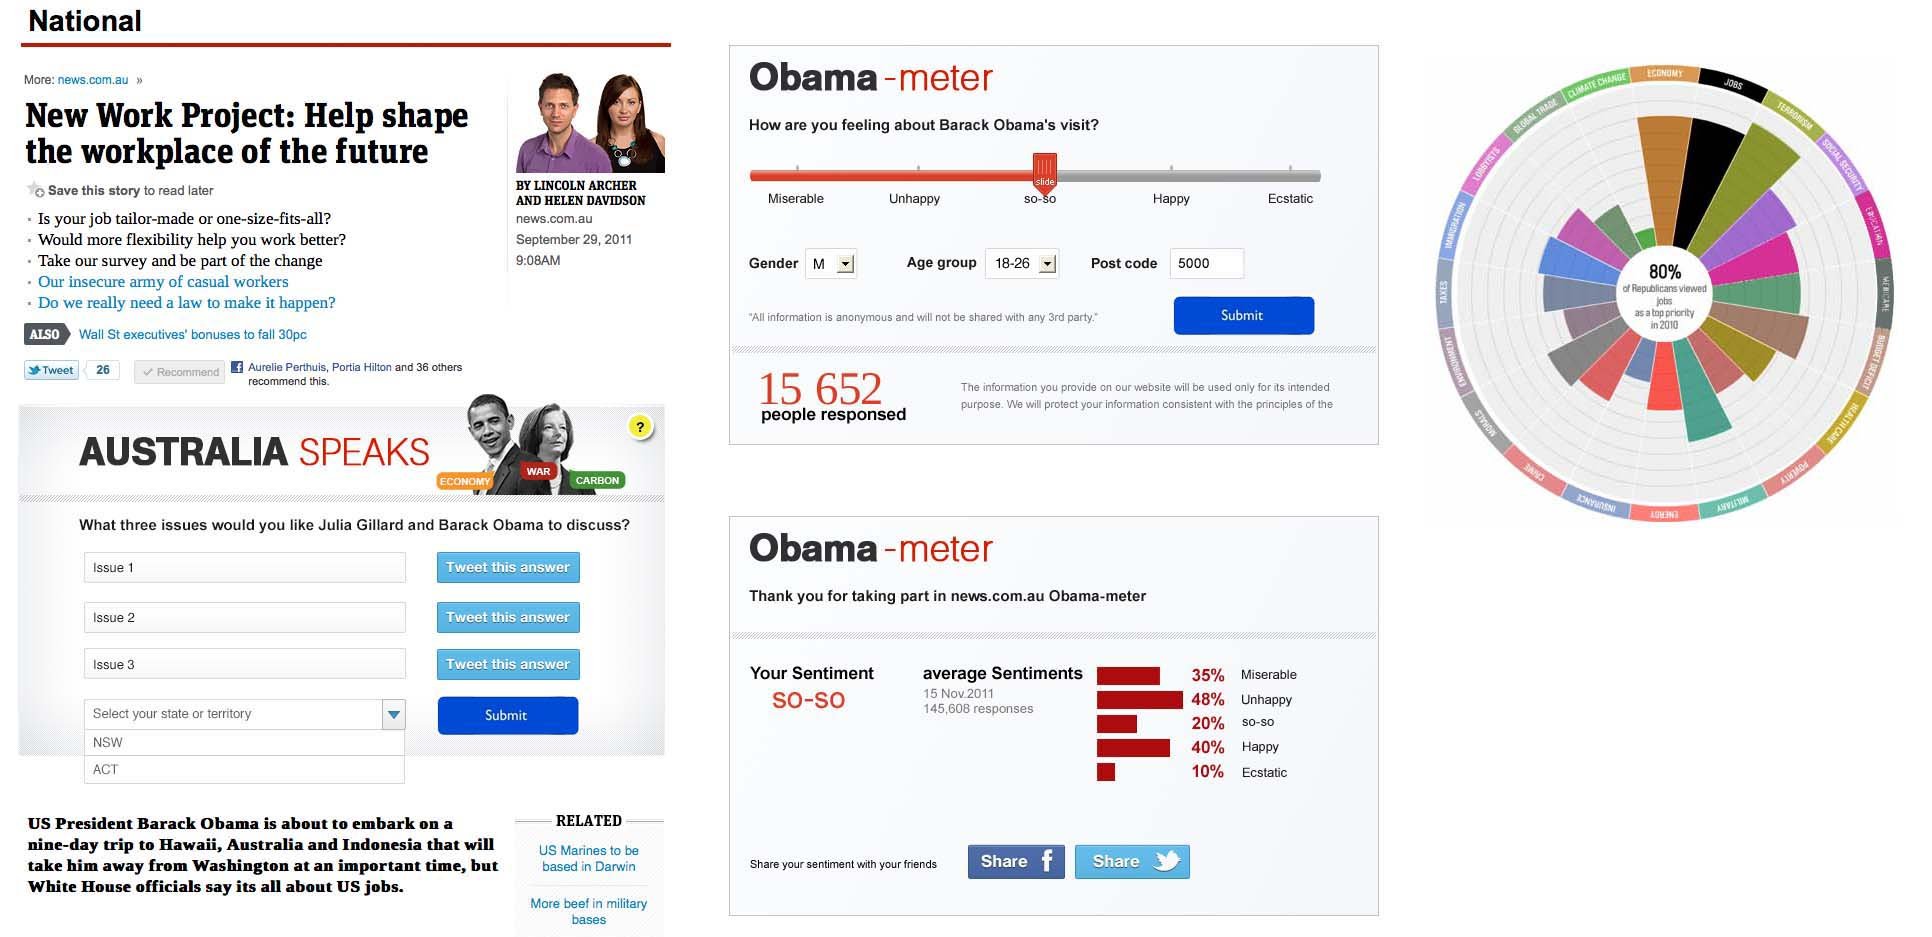
As Obama visited Australia November 2011, we then prepped some stories and data viz.
News.com.au asked Australians what are the issues they would like Julia Gillard and Barack Obama to discuss? We then visualise what are the important topics and their sentiments about Obama’s visit.
There are more mass shootings in the U.S. than in any other country in the world. Above is a snapshot of this all-too-familiar American reality all told in motion graphics.I did all the graphics and motions.
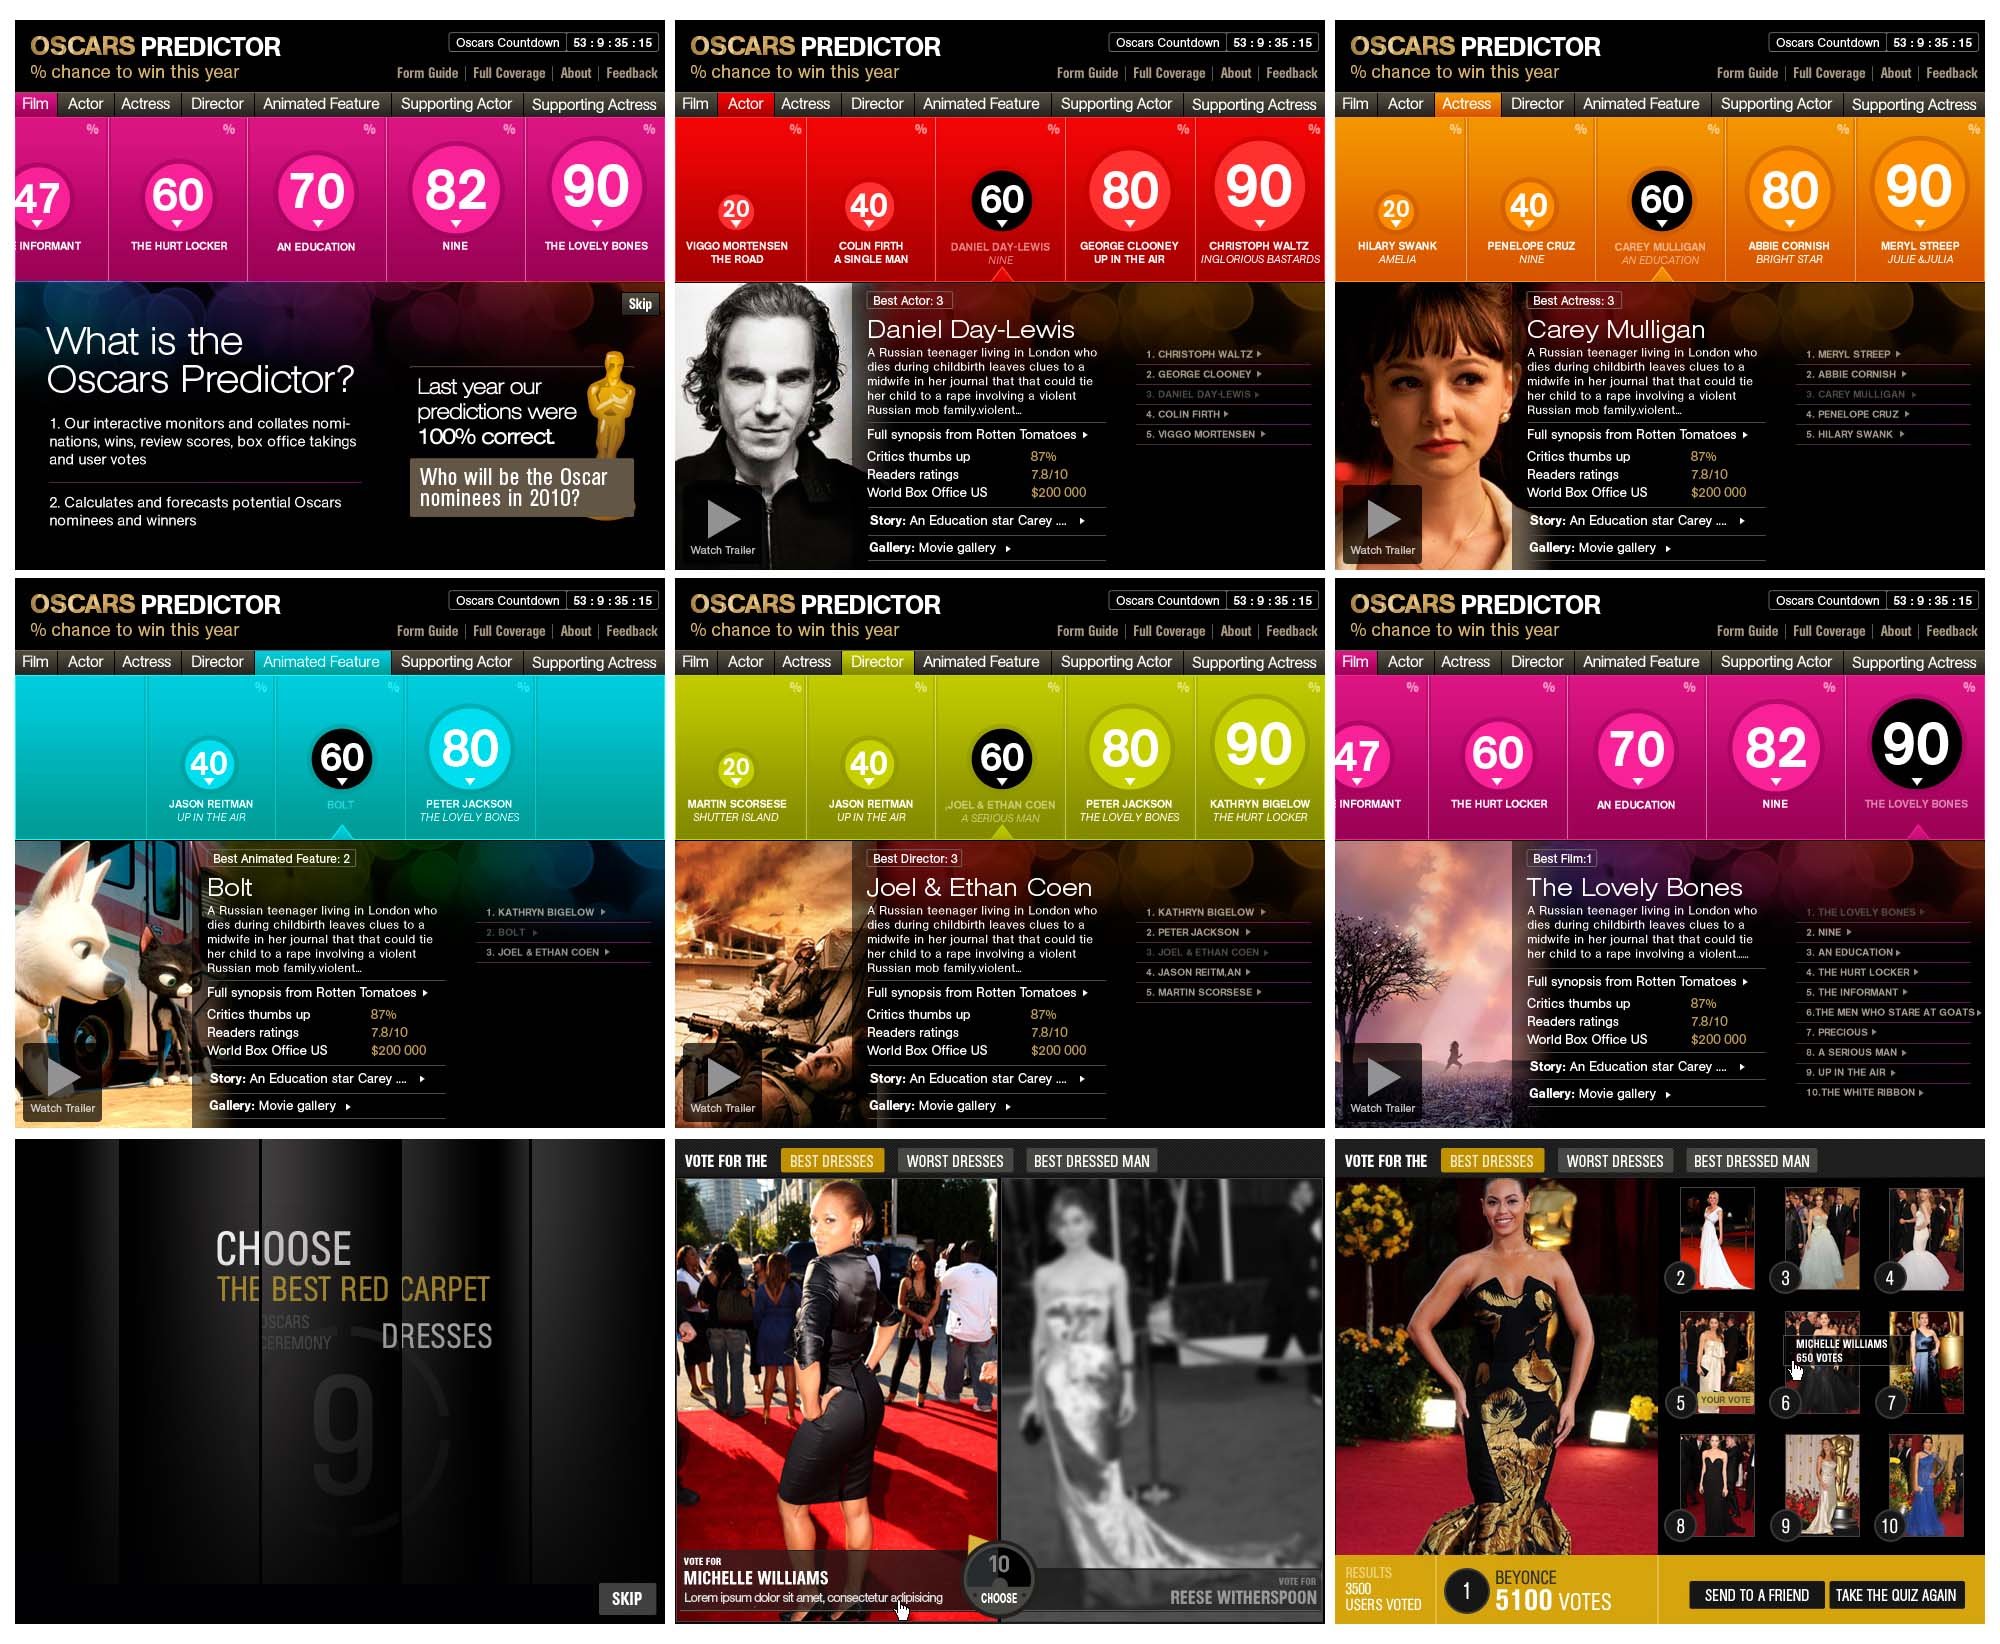
"The Oscars Predictor" was an interactive that predicted Academy Award winners by automatically monitoring data from multiple sources (nominations and awards, box office, UGC votes, collected from around the web as well as user voting).
Not only did the presentation draw readers into a story in a unique digital way, the Oscars Predictor was 100% correct, picking the winners in the seven major categories in the Academy Awards based on the data and reader votes.
The interactive was dynamic and updated results automatically depending on what was happening during the awards season.
To engage with the news.com.au readers we also launched “choose the Best and Worst Dresses”. We had a high engagement.
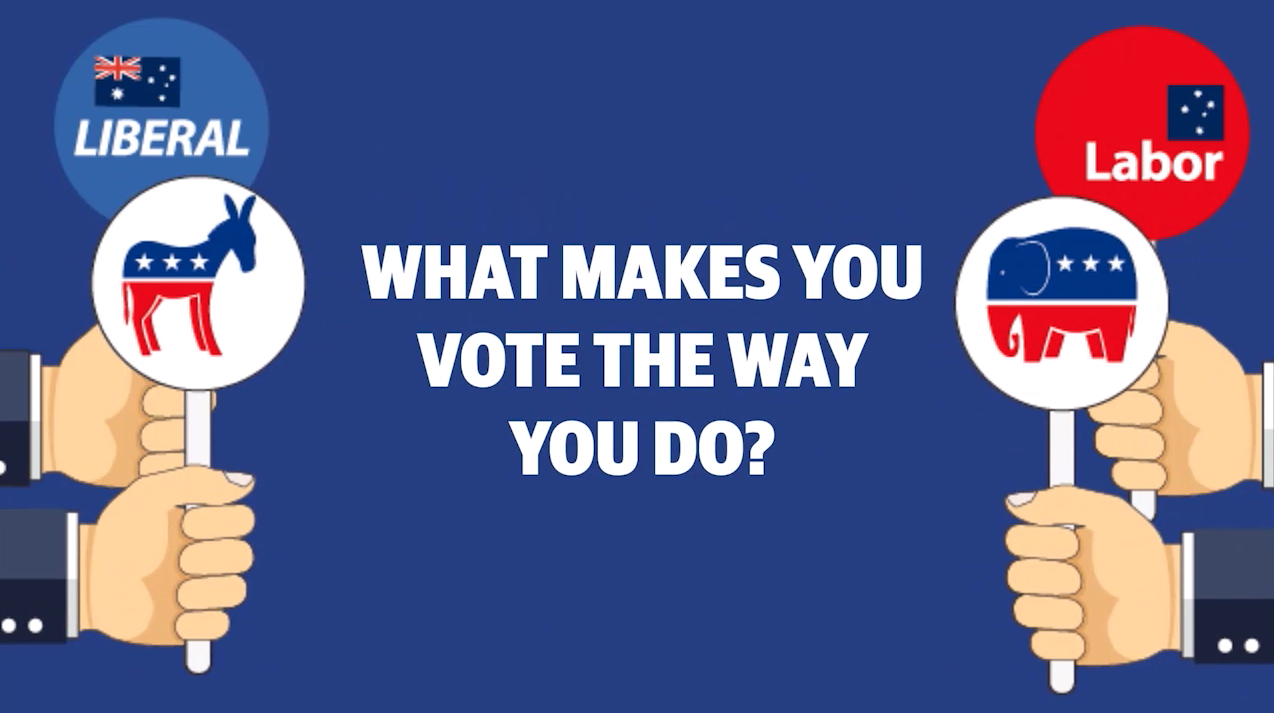
Take a look at some of the key factors, which influence one's voting decision.
READ STORY HERE
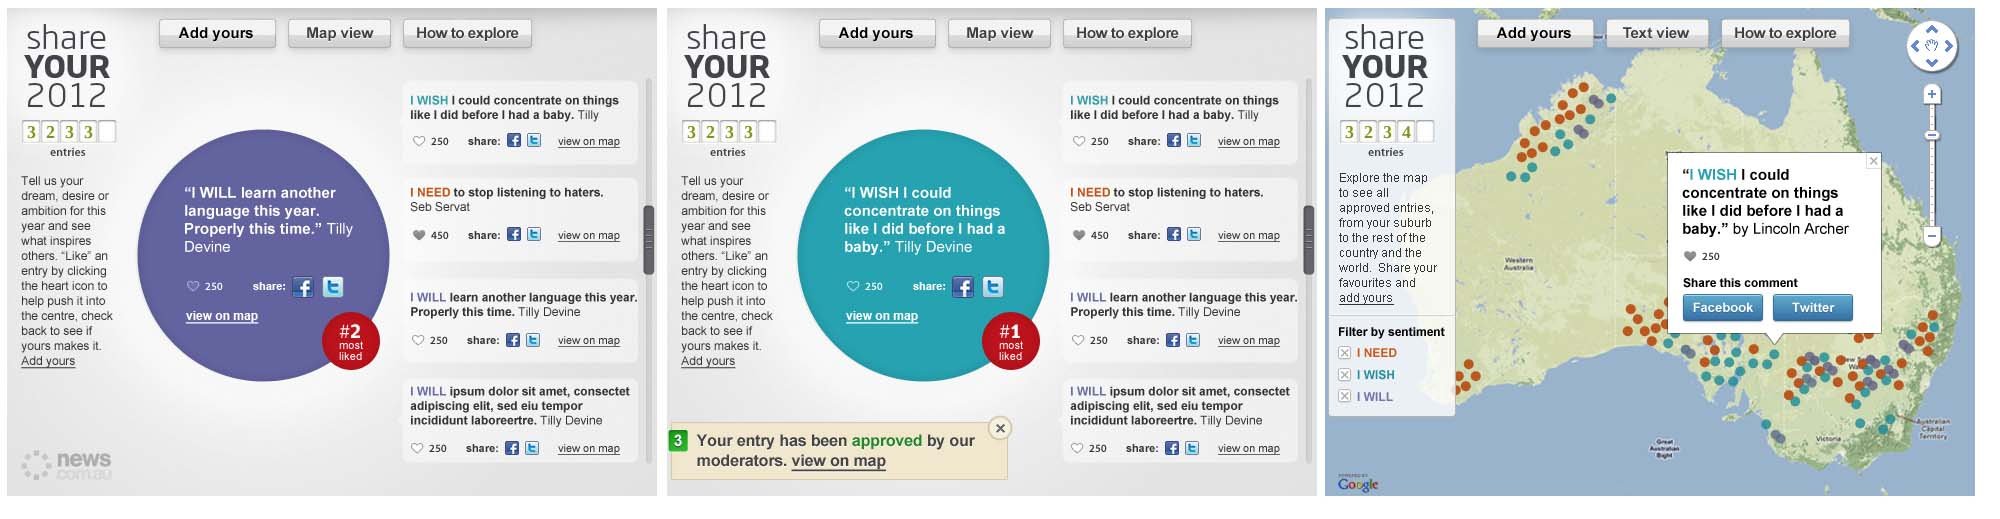
Share Your 2012
A social view of Australia’s hopes for the year ahead. That was our last interactive for the year 2011 and we wanted to do something inspiring, positive and fun.
At first, the brief suggested to use an online survey tool and once submitted, users will be redirected to review others’ hopes and dreams via a visual display.
Engagement is crucial for the success of any website,interactives or stories. You need to make sure that visitors are immediately drawn into your site, through great content, and a compelling interactive tool.
Therefore I didn’t think a survey will immediately engage with our users, and I thought that it will be best to display everyone’s wishes first, either on a text view or map view and create some buzz around it. By viewing all the wishes, users will be more likely to add theirs and share them.
The 'Share Your 2012' interactive captures everyone’s ambitions and hopes or subject that matters to them. Users can share them with friends, view entries on a map, ‘like’ it or tweet it. It’s very simple to use. Once you add your post, users will be notified when their post is approved.
People from all around the world posted some funny dreams, heartbreaking hopes, marriage proposals, stories that matter to them...
Design team lead : Aurélie Perthuis Furzer (Lily)
Designer : Vincent Vergara
Editorial team: Lincoln Archer / Helen Davidson
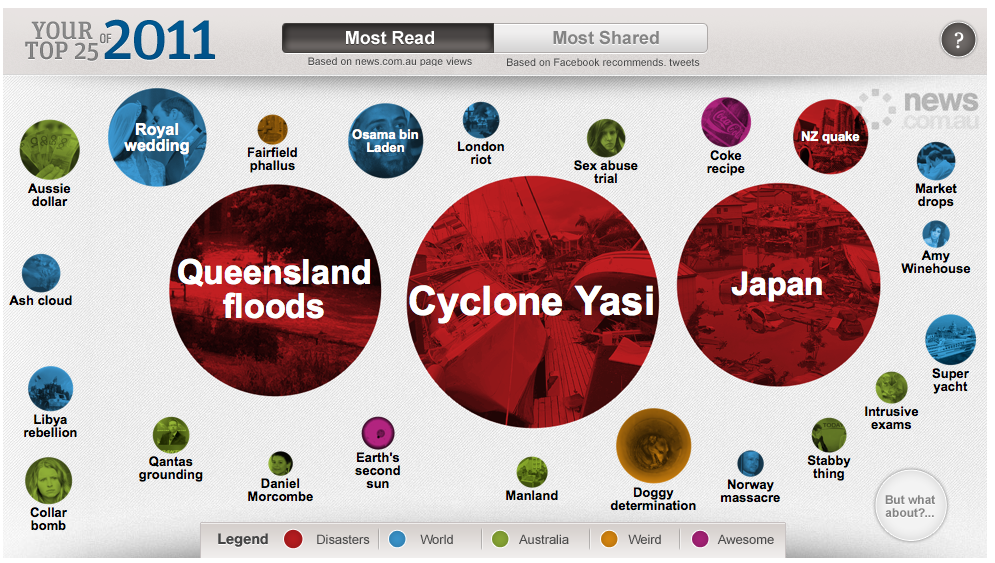
We decided to visualise the news of 2011 as decided by news.com.au readers using page views, Facebook recommends and tweets– We put together the 25 stories or events which were most-read and most-shared on our news.com.au site in 2011. The bubble size reflected the numbers.
As part of this ‘end of the year’ coverage, news.com.au created a “Care Factor” series that tackled 5 big issues or popular stories. I helped the editorial team visualising each of the stories using pie charts, timeline, maps.
In part five of our Care Factor series, we examined the aftermath of the Arab Spring - a series of revolutions streamed, blogged, tweeted, Youtubed and Facebooked, offering the world an immediate and intimate view of the downfall of a combined 128 years of power in the Middle East. In the map you can see what story came out of each of the six major uprisings to grab the attention of international observers more than any other. Viewers could find out how those stories ended, and who the most prominent faces of each revolution were.
Design team lead : Aurélie Perthuis Furzer (Lily)
Designer : Vincent Vergara
Editorial team: Lincoln Archer / Helen Davidson
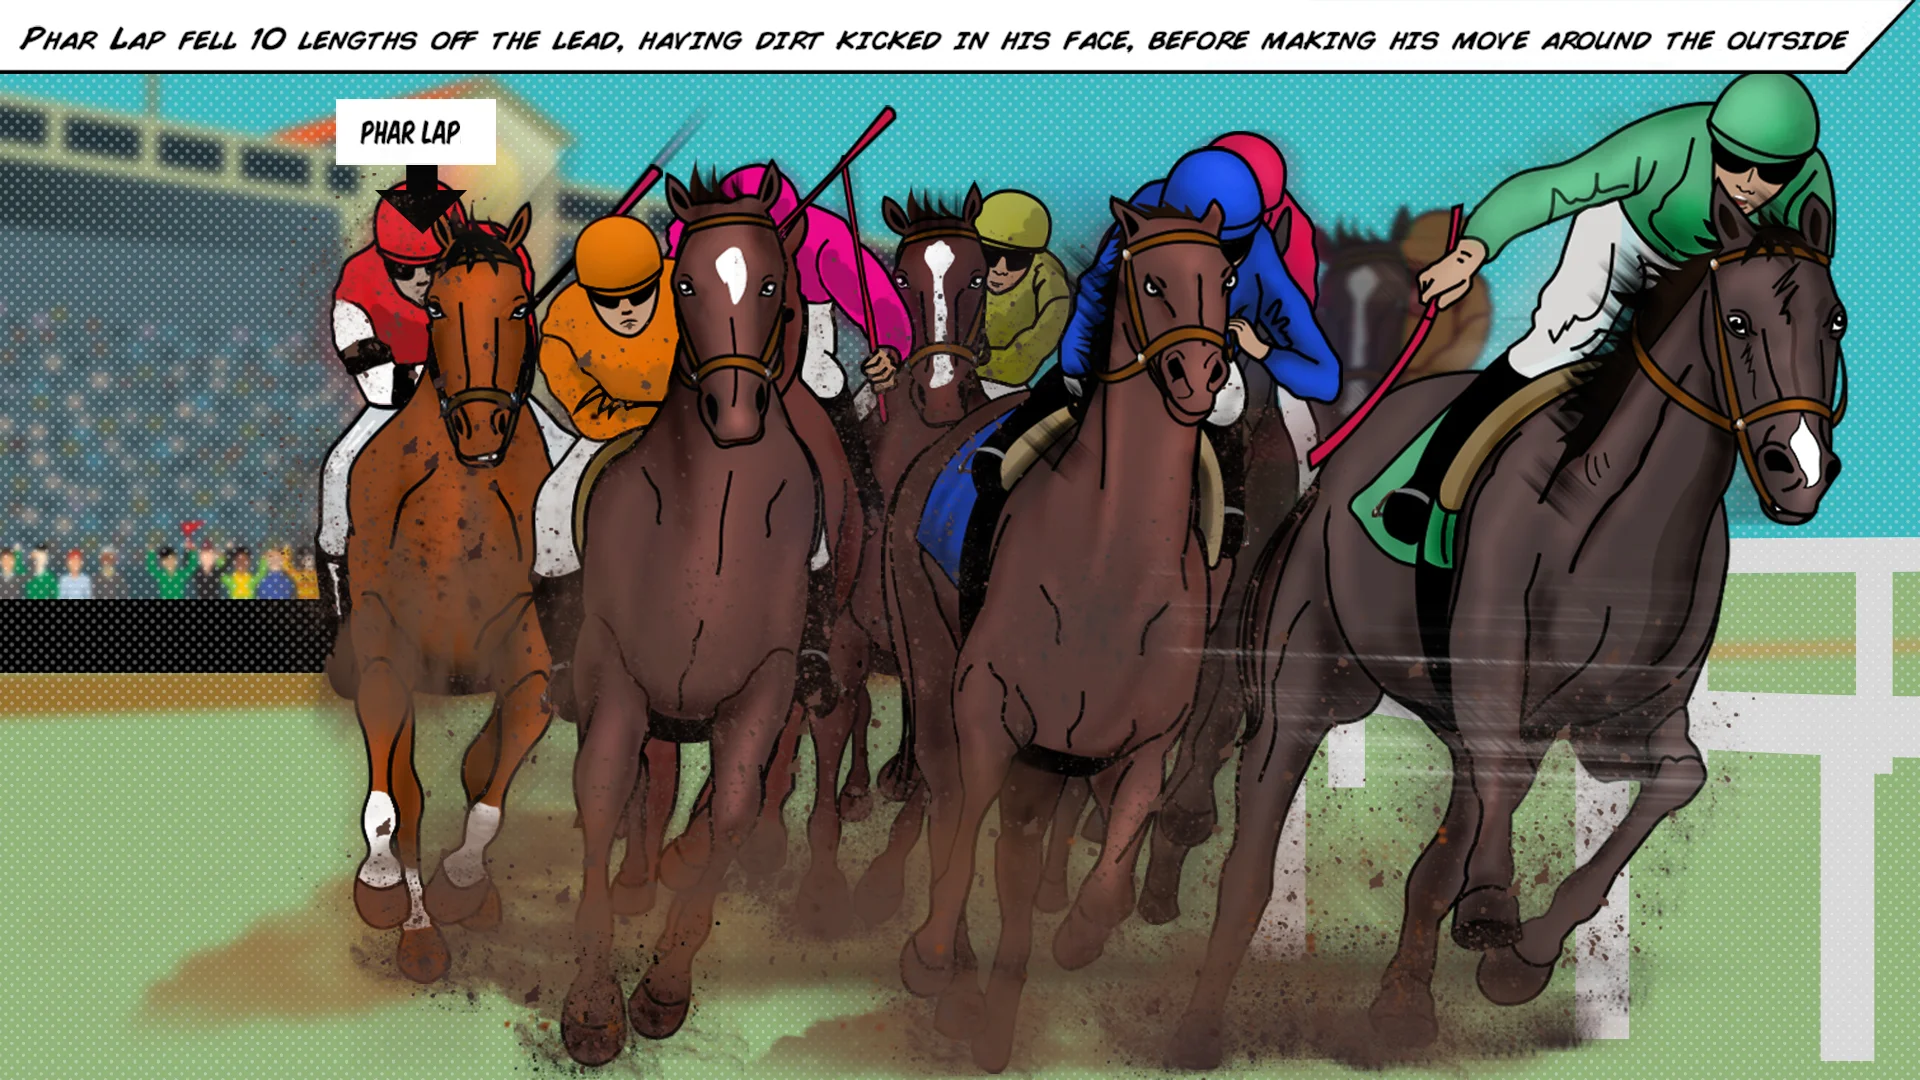
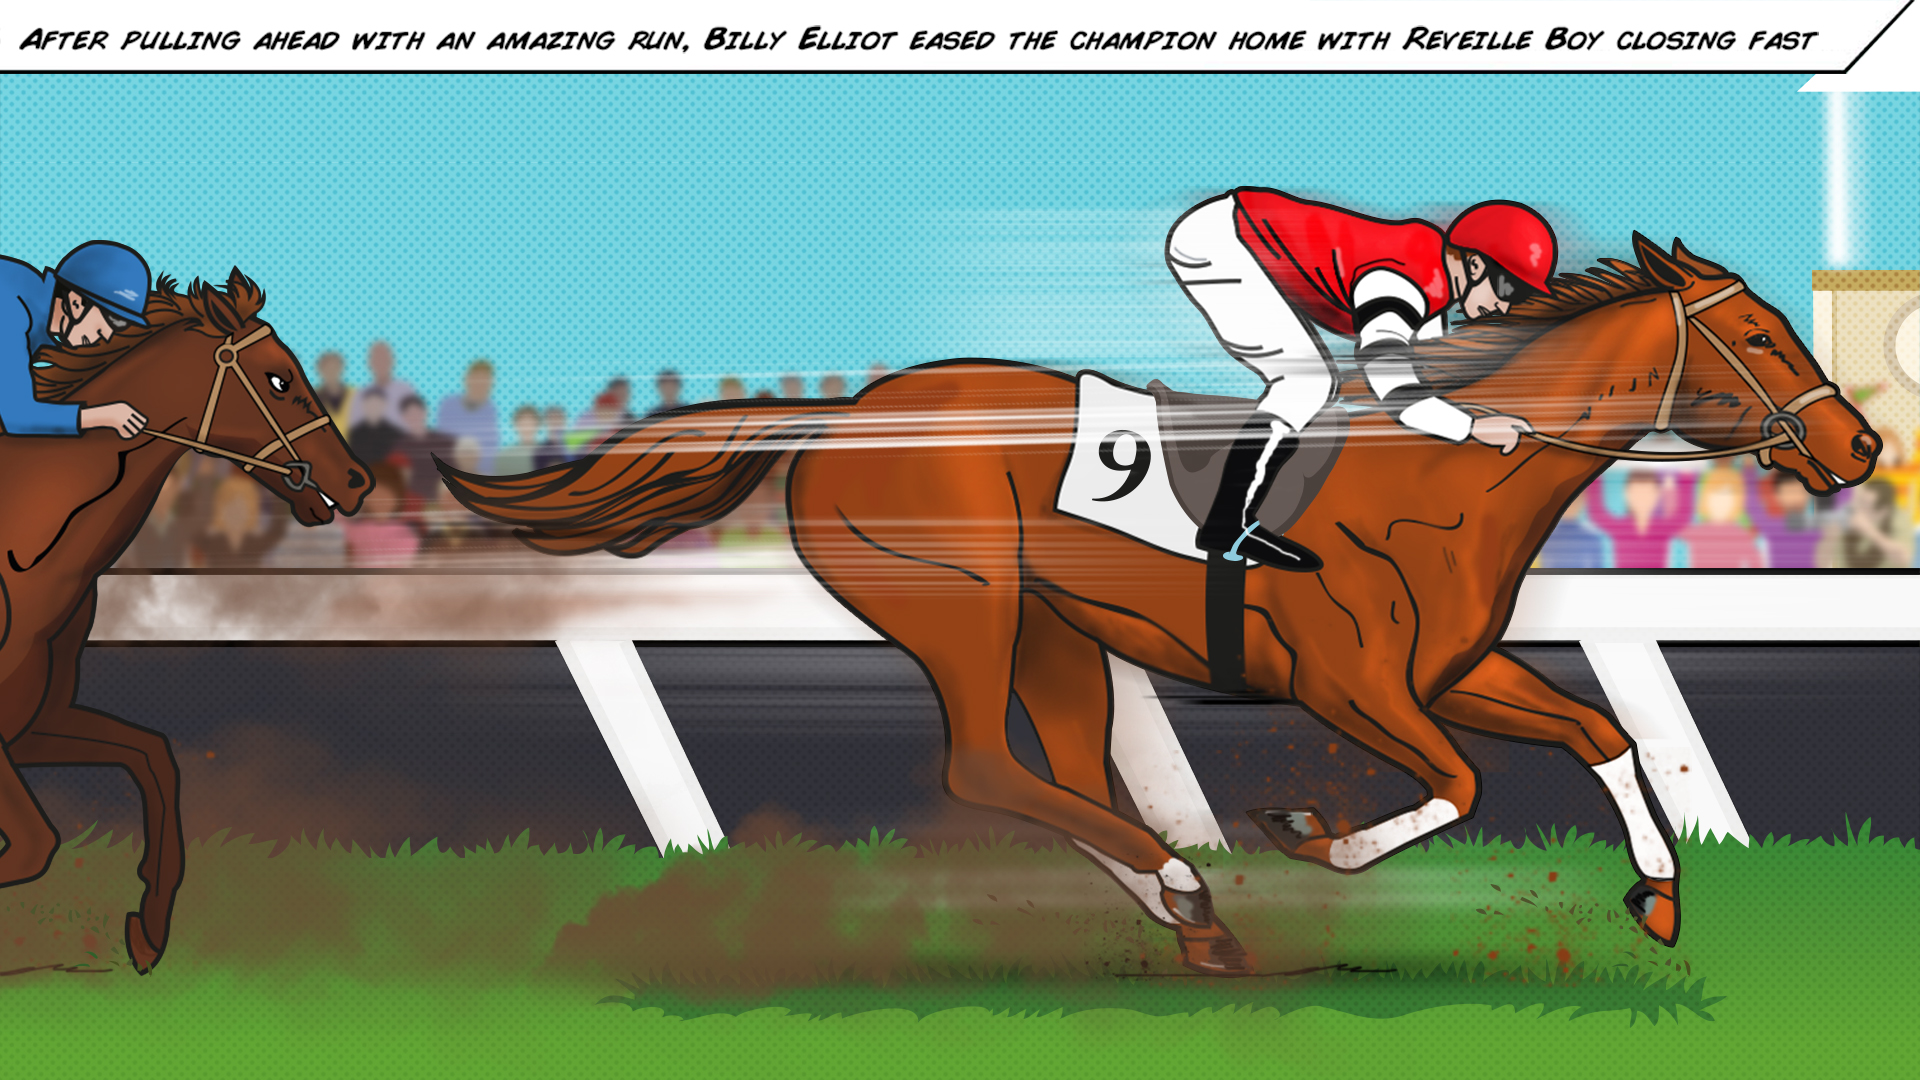
I have designed bespoke illustrations for a long form story that tells the day Phar Lap won the world’s richest race.